
Product-market fit metrics are the quantitative data and qualitative signals that reveal how well your product solves a real market need. Key indicators like user retention rates, Net Promoter Score (NPS), and the Sean Ellis Test provide a data-driven picture of whether your product is a "nice-to-have" or a true "must-have" for your customers, a critical distinction for any startup's growth strategy.
What Is Product Market Fit and Why It Matters
Product-market fit (PMF) is the pivotal moment when the market begins to pull your product from you, rather than you pushing it onto the market. It signifies that you have built something a specific group of customers genuinely needs. For a founder, relying on gut feelings can be misleading; sustainable, scalable growth is built on data.
Measuring PMF isn’t an academic exercise—it’s a fundamental business necessity for scaling a startup. Tracking the right product market fit metrics provides the clarity needed for critical decisions, from hiring your next engineer to allocating your marketing budget. Most importantly, it prevents the catastrophic mistake of trying to scale a business the market isn’t ready for. This data-driven mindset turns vague ambitions into a clear, measurable path toward building a company with a strong foundation.
The Foundation of Scalable Growth
Think of PMF as the concrete foundation for your entire company. Without it, every dollar spent on customer acquisition is a struggle, and retaining those hard-won customers is nearly impossible.
When companies achieve product-market fit, they don't just grow; they experience exponential growth. Consider Airbnb's early days. The founders were obsessed with tracking booking frequency and user return rates—clear signals of PMF. This relentless focus on core startup metrics helped them validate the needs of both travelers and hosts, fueling a yearly growth rate that shot past 100% by 2015, according to reports. Startups can achieve similar clarity through rigorous market research for startups.

For founders, product-market fit feels like the wind at your back, while its absence feels like pushing a boulder uphill. The right metrics tell you which direction the wind is blowing.
Using the Sean Ellis Test to Gauge Customer Need
While qualitative feedback is invaluable, founders need a straightforward, quantitative framework to determine if their product is a genuine "must-have." This is where the Sean Ellis Test, often called the PMF Survey, excels. It cuts through the noise with one brilliantly simple question.
The test gets right to the point, asking users: “How would you feel if you could no longer use this product?” This question is designed to elicit a gut reaction, providing a clear signal of how dependent your customers have become on your solution.

The standard multiple-choice format is crucial for benchmarking your results. The simplicity of this structure unlocks powerful insights into your core value proposition, especially from your most engaged users.
The 40% Benchmark for PMF
The magic number with the Sean Ellis Test is 40%. This rule of thumb, established by Sean Ellis after analyzing hundreds of startups, has become one of the most trusted quantitative signals of product-market fit.
His insight was simple: if at least 40% of your users would be "very disappointed" without your product, you have likely achieved PMF. Startups that cleared this hurdle almost always went on to succeed, while those who fell short often struggled with churn and scaling challenges. For another perspective, see how leading tech companies like Stripe think about product-market fit indicators.
Hitting that 40% mark is a green light for founders and investors. It’s a strong sign that you’ve built something people truly value, and you can start carefully allocating resources toward growth and customer acquisition.
However, a score below 40% is a red flag that signals it's time to refine the product or messaging, not double your ad spend. This is your cue to dig deeper into user feedback and iterate.
How to Run the Survey Effectively
To get clean, actionable data, a strategic approach is essential. Here’s a framework for running the Sean Ellis Test correctly:
- Target the Right Users: Survey users who have experienced your product's core value, not brand-new sign-ups. This typically means users who have been active for at least two weeks or have used a key feature multiple times.
- Keep It Short: The survey should be effortless. Stick to the primary question and add only one or two follow-ups. For instance, ask the "somewhat disappointed" group what alternative they would use, and ask the "very disappointed" group to describe the main benefit they receive.
- Mine the "Why": The most valuable insights are in the open-ended responses. The feedback from your "very disappointed" segment reveals your core value proposition in your customers' own words—powerful copy you can use directly for landing pages and marketing campaigns.
Tracking Your Leading Quantitative Metrics
While qualitative feedback reveals how users feel, quantitative data shows what they actually do. Numbers provide an unfiltered look at your product's traction and serve as an early warning system for your startup.
To make sense of it all, we can break down the most critical product market fit metrics into three key categories: engagement, retention, and acquisition.
Think of these as your startup's vital signs. Just as a doctor wouldn't diagnose a patient based on a single reading, a founder shouldn't judge their company's health on one metric alone. It’s the combination of engagement, retention, and unit economics that paints the full picture of your progress toward PMF.
The infographic below outlines healthy benchmarks for the key metrics we will unpack.
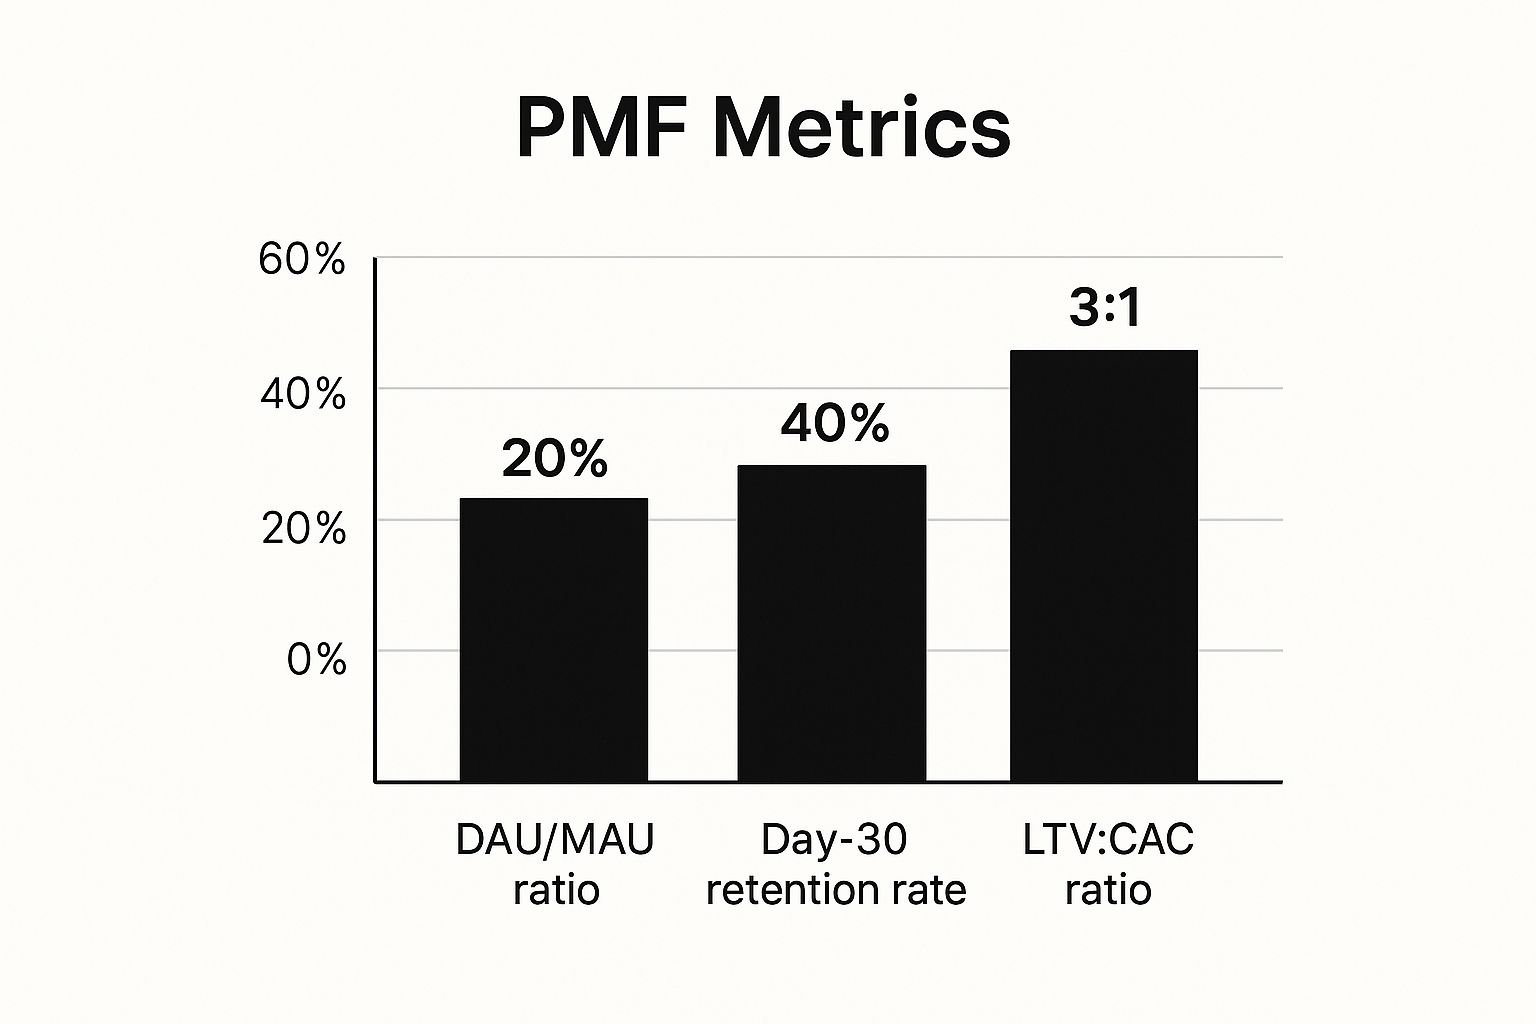
These numbers are not vanity metrics; they are actionable targets that signal a strong foundation for sustainable, scalable growth.
Key Quantitative PMF Metrics and Their Signals
| Metric | What It Measures | Healthy PMF Signal |
|---|---|---|
| DAU/MAU Ratio | How frequently users return and engage with the product. | A ratio of 20% or higher; 50%+ for top-tier social apps. |
| Cohort Retention | The percentage of users who remain active over time. | A retention curve that flattens out, not one that drops to zero. |
| LTV:CAC Ratio | The profitability of each customer relationship. | A ratio of 3:1 or higher, indicating sustainable growth. |
This table serves as a quick reference, but understanding the "why" behind each number is what gives a founder a strategic edge.
Engagement and Stickiness
First, are people actually using your product consistently? An initial wave of sign-ups means little if those users disappear. This is where you measure stickiness—how well your product integrates into a user's routine.
The go-to metric for this is the DAU/MAU ratio, which compares your Daily Active Users (DAU) to your Monthly Active Users (MAU).
A DAU/MAU ratio of 20% or higher is generally a strong signal for SaaS platforms, indicating that a solid portion of monthly users are returning daily. For social products, the bar is even higher, with elite companies hitting 50% or more.
A strong ratio proves your product is becoming a habit, not just a curiosity.
Retention and Cohort Analysis
While engagement provides a snapshot, retention tells the story over time. This is arguably the most powerful signal of product-market fit. If people stick around, you’ve built something they truly need.
To measure this effectively, you must use cohort analysis. This framework involves grouping users by their sign-up date (e.g., the "January cohort") and tracking the percentage of that group still active in subsequent weeks or months.
This is critical because it prevents the "leaky bucket" problem. Your total user count may be rising, but cohort analysis reveals if you're losing users as fast as you acquire them. A healthy retention curve that flattens over time is the ultimate proof of PMF—it shows you have a core group of loyal users who can't live without your product.
Acquisition and Unit Economics
Finally, your growth must be sustainable. This is where unit economics, specifically the Lifetime Value (LTV) to Customer Acquisition Cost (CAC) ratio, comes in. This metric answers a fundamental question for investors and founders alike: are you making more money from customers than you spend to acquire them?
- LTV (Lifetime Value): The total revenue you expect from a single customer over the entire relationship.
- CAC (Customer Acquisition Cost): The total sales and marketing cost to acquire one new customer.
A healthy LTV:CAC ratio is widely considered to be 3:1 or better, as cited by sources like TechCrunch. For every dollar spent on customer acquisition, you should generate at least three dollars back. A 1:1 ratio means you're buying revenue at a loss. Conversely, a 5:1 ratio may indicate underinvestment in growth and missed opportunities.
For a deeper dive into these and other key performance indicators, explore our collection of articles on startup metrics.
Finding PMF Clues in Qualitative Feedback
Quantitative metrics tell you what is happening, but they rarely explain why. That’s where your customers' own words provide essential context.
Think of qualitative feedback as the story behind the numbers. It’s the color commentary that turns raw data into a clear picture of what’s working and what’s not. These narratives are powerful lagging indicators that confirm you’re building something people genuinely love, not just tolerate.
From Satisfaction to Advocacy with Net Promoter Score
One of the simplest yet most powerful frameworks for capturing customer sentiment is the Net Promoter Score (NPS). This survey is built around a single question: "On a scale of 0 to 10, how likely are you to recommend our product to a friend or colleague?"
Based on their responses, customers are categorized into three groups:
- Promoters (9-10): Your champions. They actively fuel word-of-mouth growth.
- Passives (7-8): Satisfied but not loyal. They are susceptible to competitive offers.
- Detractors (0-6): Unhappy customers who may churn or spread negative feedback.
Your final NPS score is calculated by subtracting the percentage of Detractors from the percentage of Promoters. While benchmarks vary by industry, a score above 30 is generally a good sign of word-of-mouth potential. A score over 50 indicates a passionate, loyal user base.
Mining for Gold in Customer Conversations
Powerful PMF signals are often hidden in plain sight within your everyday customer interactions. The key is knowing where to look and how to listen.
The specific language customers use when they praise or recommend your product is often the best marketing copy you'll ever get. It reflects your true value proposition in words that resonate with your target audience.
Keep an ear to the ground in these key channels:
- Support Tickets: Consistent requests for the same feature are not complaints; they are a roadmap pointing directly to unmet needs.
- Social Media Mentions: Unsolicited praise on platforms like Twitter or LinkedIn is an unfiltered signal of excitement. Track which features people are raving about.
- Online Reviews: Sites like G2 or Capterra are treasure troves of detailed feedback. Pay close attention when reviewers compare you favorably to a well-known competitor.
The trick is to systematize this feedback. Create a simple process to tag and categorize these anecdotes. This allows your product team to spot trends long before they appear in quantitative data.
For a more structured approach, consider creating a direct line to your most engaged users. Our guide on building powerful customer advisory boards shows you how to get invaluable, real-time insights that can shape your roadmap and confirm you're solving the right problems.
Building Your Startup PMF Dashboard
Putting theory into practice means consolidating your product-market fit metrics into a single, coherent view. A PMF dashboard isn’t a complex piece of software; it's a focused collection of data that tells you where you stand. Crucially, this dashboard must evolve with your startup, reflecting the challenges of each funding stage.
Think of it as a living document for your leadership and team. You're not tracking every metric possible; you're zeroing in on the vital few that provide the clearest signal for your current stage. This practice helps avoid vanity metrics and keeps your team focused on what truly matters for growth.

Pre-Seed Stage: The Search for a Signal
At the pre-seed stage, your sole objective is to validate that the problem you're solving is real and that users care about your solution. Your dashboard will be light on complex quantitative data and heavy on qualitative feedback.
- Primary Metric: The Sean Ellis Test Score. Your north star is hitting the 40% "very disappointed" benchmark. It's the cleanest early sign that you've built something people need.
- Secondary Metrics: Look for themes in qualitative feedback from user interviews and survey responses. Are customers consistently highlighting the same "aha!" moment or core benefit?
Case Example: A composite startup, "FinTech Innovators," had an initial Sean Ellis score of 22%. Instead of panicking, the founders analyzed the open-ended feedback and discovered their marketing highlighted a confusing feature. This insight led to a critical pivot in their messaging and value proposition.
Seed Stage: Proving Retention and Engagement
Once you have an early signal, the seed stage is about proving your product has staying power. Your dashboard must now incorporate hard numbers demonstrating user stickiness and the beginnings of a healthy growth engine.
At this stage, your focus shifts from "do they want it?" to "do they keep using it?" Retention is the single most important indicator of true product-market fit.
Your dashboard should now feature:
- Primary Metric:Cohort Retention Curves. You need to see the curve begin to flatten, proving a core group of users is sticking around long-term.
- Secondary Metrics: A DAU/MAU Ratio to measure habit formation and an early Net Promoter Score (NPS) to gauge word-of-mouth potential.
After their pivot, FinTech Innovators re-ran the Sean Ellis test and hit 43%. They then built their seed-stage dashboard, focusing on 30-day cohort retention. Seeing the curve flatten at 35% gave them the confidence—and the data—to show investors they had a genuinely sticky product, a key milestone for funding for early-stage companies.
Series A Stage: Optimizing for Scalable Growth
By the time you're raising a Series A, you have proven that people want and will stick with your product. The game changes to proving you can acquire customers profitably and at scale. Your dashboard becomes more financially focused, centered on unit economics.
- Primary Metric:LTV:CAC Ratio. Investors will look for a healthy ratio, ideally 3:1 or higher, to prove your business model is sustainable and ready for scaling.
- Secondary Metrics: A consistently high NPS (ideally 50+) demonstrates strong brand loyalty, while segmenting retention data can pinpoint your most valuable customer profiles.
For their Series A pitch, FinTech Innovators led with their 3.8:1 LTV:CAC ratio. That number, combined with a strong NPS of 52, painted a clear picture. They didn't just have product-market fit; they had a clear, scalable path to market leadership, which helped them secure their next round of funding.
Common Questions About Product Market Fit Metrics
Working with PMF metrics can feel abstract. Founders are constantly asking where to focus their limited time and energy to get a real signal. Let's tackle some of the most common questions to provide the clarity needed to move forward with confidence.
How Often Should I Measure My PMF Metrics?
The right cadence depends on the metric. Checking everything daily is a recipe for overreacting to statistical noise and making poor decisions. A balanced approach is key.
- Weekly: Check leading quantitative metrics like user engagement (DAU/MAU ratio). This frequency is ideal for spotting short-term trends in product usage.
- Monthly: Deeper metrics like cohort retention are best analyzed month-over-month. This gives you enough data to see if users are genuinely sticking around.
- Quarterly: Qualitative surveys like the Sean Ellis Test or NPS should be run quarterly. This schedule tracks shifts in customer sentiment without causing survey fatigue.
Can I Have PMF in One Segment but Not Another?
Yes, absolutely. This is one of the most powerful realizations for an early-stage startup. It's rare for a new product to achieve broad market fit immediately. More often, a startup finds a small, passionate niche that adores the product while the wider market remains indifferent.
This isn't failure; it's a strategic insight. If you have strong PMF with a specific customer segment, double down. Pour your energy into serving that core group better than anyone else.
This is often called a "beachhead" strategy. It's about building a strong, defensible foothold in one part of the market. Once you dominate that niche, you can use it as a launchpad to expand into adjacent segments.
What Are the Biggest Mistakes When Tracking PMF?
When measuring product-market fit, founders tend to fall into a few common traps. Awareness of these pitfalls can ensure you act on clean, meaningful data.
Here are the most common mistakes:
- Chasing Vanity Metrics: Focusing on top-of-funnel numbers like sign-ups or downloads feels good but says nothing about whether users are getting sticky value from your product.
- Ignoring Qualitative Context: Relying only on numbers can be misleading. Quantitative data tells you what is happening, but customer feedback tells you why. You need both for a complete picture.
- Scaling Prematurely: This is the most dangerous mistake. Pouring capital into marketing before your retention and engagement numbers are solid is like trying to fill a leaky bucket—you'll burn cash with little to show for it.
At Spotlight on Startups, we provide the frameworks and insights you need to build a resilient, data-driven company. Explore our resources to master the art of turning early signals into sustainable growth. Find out more at https://spotlightonstartups.com/.