
A startup's financial projection template is more than a spreadsheet; it's your business's story, told in numbers. For founders seeking investment, it's the document that translates a grand vision into a concrete financial roadmap, showing potential investors not just what you plan to do, but how you'll build a profitable, scalable venture.
Think of it as the essential bridge between a brilliant idea and a fundable company—a core component of founder excellence.
Why Projections Are a Startup's Strategic Roadmap
Too many founders treat financial projections as a necessary evil for fundraising—a static document created once and then filed away. This is a massive missed opportunity. A well-built forecast is one of the most powerful decision-making tools in a founder's arsenal. It acts as a dynamic guide for navigating the turbulent waters of early-stage growth.
It's the difference between proactively scaling your business and simply reacting to one crisis after another.
For example, a dynamic financial model can help a leadership team spot critical cash flow gaps weeks or even months ahead. This foresight provides the chance to adjust spending, accelerate customer acquisition efforts, or kick fundraising into high gear before it becomes an emergency. This isn't just about showing VCs you have a plan; it’s about having a real-time operational dashboard for yourself.
Validating Your Business Model
At its core, a startup financial projections template forces you to get brutally honest about the core assumptions your entire business is built on. It makes you answer the tough questions that will determine your startup's long-term viability:
- Is our pricing strategy sustainable? Modeling different price points reveals their impact on revenue and, more importantly, profitability and market positioning.
- Can we acquire customers efficiently? Projecting your customer acquisition cost (CAC) against their lifetime value (LTV) is the ultimate test of your go-to-market strategy. A healthy LTV:CAC ratio is a key indicator investors look for.
- When will we reach profitability? The forecast pinpoints your break-even point, giving the entire team a clear, tangible target to rally around.
This process turns abstract ideas into a financial narrative that investors can understand and your team can execute against. It’s a crucial piece of your overall strategy, a topic we explore in our guide on how to write a winning startup business plan investors actually read.
Mitigating Financial Risk
Precise forecasting is your best defense against running out of money—the most common startup killer. According to data from CB Insights, over one-third of startup failures are due to running out of cash. This is a stark reminder of how critical financial foresight and sound operations management are.
The good news is that founders who regularly update their projections and seek feedback from mentors or advisors create more accurate forecasts. The result is better decision-making and a higher likelihood of survival. You can discover more insights on financial planning from SCORE to support this practice.
By treating your financial model as a living document, you’re not just planning for success—you’re actively building resilience against the most common causes of startup failure. It becomes your early warning system, allowing you to make tough operational decisions with confidence.
A truly comprehensive financial projection is built on several key statements that work together to paint a full picture of your startup's health and potential. Each one serves a distinct purpose, from tracking cash flow to outlining long-term profitability.
Key Components of a Comprehensive Financial Projection
This table breaks down the essential statements and analyses that form the backbone of any credible startup financial forecast.
| Component | Purpose | Typical Time Horizon |
|---|---|---|
| Income Statement | Shows your company's profitability (Revenue – Expenses = Net Income) over a period. | 3-5 Years |
| Cash Flow Statement | Tracks the movement of cash in and out of the business, highlighting operational health. | 3-5 Years |
| Balance Sheet | Provides a snapshot of your company’s financial position (Assets = Liabilities + Equity). | 3-5 Years |
| Sales Forecast | Projects future revenue based on market analysis, pricing, and sales strategy. | 3-5 Years |
| Personnel Plan | Details hiring plans, salaries, and associated costs as the team grows. | 3-5 Years |
| Break-Even Analysis | Determines the point at which total revenue equals total costs. | 1-2 Years |
Understanding these components is the first step. Next, we'll explore the nuts and bolts of building them out in your own template.
Laying the Groundwork: Nailing Your Core Assumptions
A financial projection template is just an empty spreadsheet until you breathe life into it with your assumptions. These inputs aren't just numbers—they're the very foundation of your startup's financial story. Get them wrong, and your model will crumble under the first tough question from an investor or the hard realities of the market. This isn't just about filling in blanks; it's about building a solid base for your entire forecast.
Before you open Excel or Google Sheets, you need to anchor your big vision in credible data. This process forces you to translate broad ideas into specific, defensible numbers that will drive every calculation that follows.

Defining Your Market and Nailing Down Pricing
First, you must understand the sandbox you’re playing in. That starts with your Total Addressable Market (TAM). Don't treat this as a mere academic exercise for a slide deck. Your TAM defines the ultimate revenue potential of your business, and it's one of the first things savvy VCs will scrutinize.
Once you know the size of the prize, you must determine how you're going to charge for your product. Your pricing strategy has a direct ripple effect on every projection you’ll make.
- Sizing Up the Competition: What are similar companies charging? Analyze their models—are they using freemium, tiered subscriptions, or one-time fees? This helps you position your own offering strategically.
- Pricing Based on Value: What is the tangible economic value your product provides to a customer? A B2B SaaS tool that saves a company $5,000 per month has the justification to command a much higher price than one that’s just priced to match competitors.
- The Cost-Plus Method: This is a straightforward approach: calculate all your costs to deliver the product (COGS) and add a standard markup. It’s simple, but be warned—this method often leaves money on the table because it ignores the value you create for the customer.
A classic startup mistake is pricing too low out of the gate, hoping to grab market share fast. This can devalue your product in the eyes of customers and make the path to profitability incredibly steep.
Calculating Your Key Growth Levers
With your market and pricing assumptions locked in, it’s time to quantify the engine of your growth: customer acquisition. For any early-stage startup, two of the most vital metrics are Customer Acquisition Cost (CAC) and Lifetime Value (LTV).
A healthy, sustainable business model requires an LTV that is significantly higher than its CAC. The gold standard ratio that investors look for is 3:1 or more.
Founder Excellence: Don't just pull your CAC out of thin air. Build it from the bottom up based on your actual go-to-market plan. If your strategy is heavy on paid ads, project your cost-per-click, conversion rates, and total ad spend. If you're building a direct sales team, factor in salaries, commissions, and how many deals a single rep can realistically close each month.
Getting this granular transforms your assumptions from wild guesses into a credible, operational plan. It shows investors you’ve thought through not just the what but, more importantly, the how of your growth strategy. These core inputs—TAM, pricing, CAC, and LTV—are the essential building blocks for your entire financial model.
Building Your Three Core Financial Statements
With your assumptions wrangled, it's time to translate that thinking into the language investors and stakeholders speak: the three core financial statements. These aren't separate spreadsheets; they are the interconnected core of your financial model. Get one right, and it feeds the others.
Think of them as different camera angles on your business. The income statement shows performance over time, the balance sheet is a single snapshot, and the cash flow statement tracks the lifeblood of your operation—cash.
A solid startup financial projections template is your roadmap here, helping you forecast revenue, expenses, and profitability over the typical three-to-five-year horizon investors expect. If you want to see how these pieces fit together visually, HubSpot has a detailed breakdown worth checking out.

The Income Statement: Profit and Loss
This is your Profit and Loss, or P&L. It tells the story of your startup’s profitability in a simple but powerful formula: Revenue – Expenses = Net Income. It answers the most fundamental question: is this business model financially sound? Are you making more than you're spending over a month, a quarter, or a year?
Getting the categories right is everything.
- Revenue: Your top line. For a SaaS business, this is your monthly recurring revenue (MRR).
- Cost of Goods Sold (COGS): These are the direct costs tied to delivering your product. For a hardware startup, it’s raw materials and manufacturing. For SaaS, think server hosting fees or third-party API costs that scale with your customer base.
- Operating Expenses (OpEx): These are the costs of keeping the lights on. Salaries, marketing spend, rent, and software subscriptions (like your CRM) all live here. They aren't tied directly to a single sale.
Your gross profit (Revenue – COGS) tells you how efficiently you deliver your service. Your net income is the bottom line—what’s left after every bill is paid.
The Cash Flow Statement: The Survival Metric
Many profitable startups have gone under. Why? They ran out of cash. The cash flow statement is the tool that prevents that mistake. It tracks the actual movement of cash in and out of your bank account, making it arguably the most critical document for survival.
Founder Excellence: Profit is an accounting concept, but cash is reality. You can't pay your team with "accounts receivable." The cash flow statement is your reality check.
Here’s a classic scenario: your P&L shows a fantastic, profitable month because you signed a massive enterprise client. But that client is on Net 90 payment terms. That means the cash won’t hit your bank for three months. The cash flow statement makes this dangerously clear, helping you manage your runway before you fly off a cliff.
The Balance Sheet: A Financial Snapshot
Finally, the balance sheet gives you a snapshot of your company’s financial health at a single point in time. It all boils down to one core equation: Assets = Liabilities + Equity. It shows what you own, what you owe, and what’s left for the owners.
Let’s break that down:
- Assets: Resources you own that have value. This includes cash in the bank, equipment, and—importantly—accounts receivable (money you're owed).
- Liabilities: What your company owes. Think accounts payable (money you owe suppliers), bank loans, and deferred revenue (cash from customers for services you haven't delivered yet).
- Equity: The owners' stake. It’s what’s left when you subtract liabilities from assets, including the capital you and your investors have put in.
These three statements don't exist in a vacuum. They are completely intertwined. A spike in revenue on your income statement will ripple through the others, boosting your cash balance and strengthening your balance sheet. This is the financial engine of your startup.
Forecasting Revenue and Realistic Customer Growth
Your revenue forecast is where your startup’s story truly comes alive in numbers. It's often the most heavily scrutinized part of your financial model because it forces you to translate big market assumptions into a believable, month-by-month growth story. When it comes to building that story, there are two classic methods: top-down and bottom-up forecasting.
You need both. Investors want to see the big-picture context from a top-down analysis, but they need the operational credibility of a bottom-up forecast to believe you can execute.
The Top-Down Sanity Check
The top-down approach starts with the Total Addressable Market (TAM). You look at the entire market size and then carve out a realistic slice that you believe your startup can capture over the next few years. It’s the perfect way to frame the scale of the opportunity for an investor deck.
For instance, if the global market for your B2B SaaS tool is $10 billion, showing that you only need to capture 0.5% of it to build a $50 million business sounds achievable. This high-level view demonstrates your ambition and market awareness. But on its own, it tells investors what the potential is, not how you'll get there.
This process flow visualizes how revenue projections, expense estimates, and cash flow computation fit together.
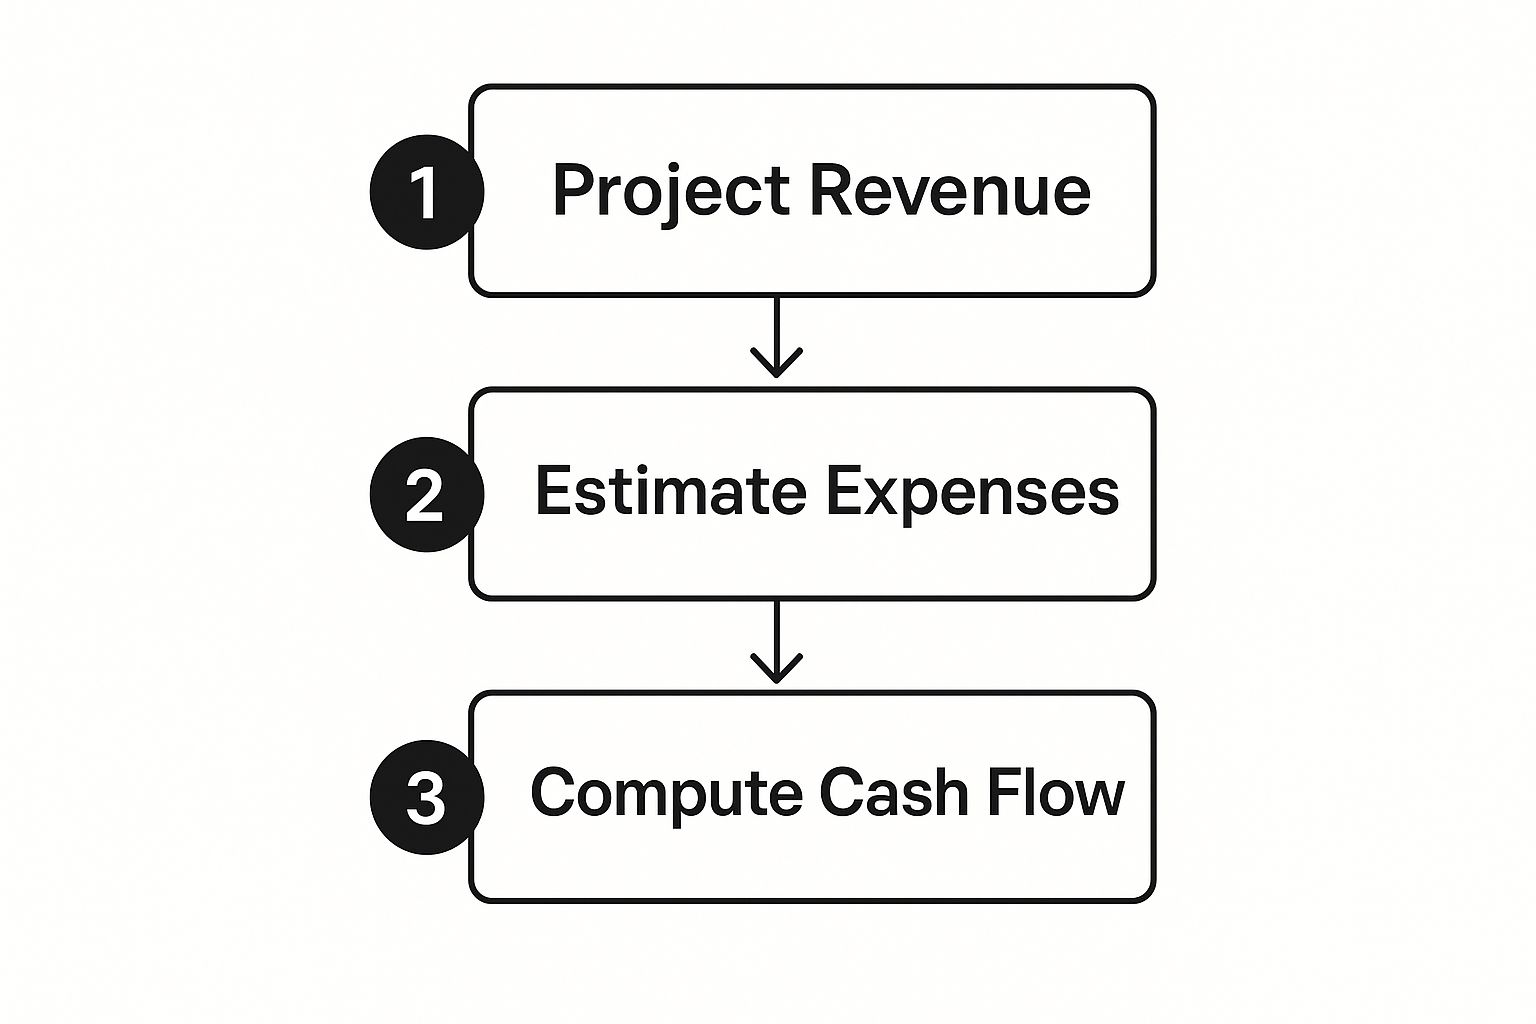
As you can see, revenue is the engine. It’s the starting point that directly dictates how you can budget for expenses and manage your cash runway.
The Bottom-Up Build
This is where the real work—and the real credibility—comes in. A bottom-up forecast builds your revenue projections from tangible, controllable drivers. Instead of looking at the market, you start with your own operational capacity. What can your team actually do?
This approach is grounded in reality. It forces you to connect every dollar of projected revenue directly back to your team’s actions and your company's resources.
Founder Excellence: Investors trust bottom-up forecasts because they are built on specific, measurable activities. A projection based on your sales team's quota or your marketing funnel's conversion rate is far more convincing than a simple percentage of a massive market.
Let's walk through a quick example for a B2B SaaS startup trying to hit $240,000 in Annual Recurring Revenue (ARR) in its first year. Here’s what a simplified bottom-up model looks like:
- Average Revenue Per Account (ARPA): $500/month ($6,000/year)
- Target Customers Needed: 40 ($240,000 / $6,000)
- Lead-to-Customer Conversion Rate: 5%
- Leads Needed: 800 (40 customers / 0.05 conversion rate)
Suddenly, the goal becomes much clearer. The marketing team needs to generate about 67 qualified leads per month. Now your revenue forecast is tied to a concrete marketing KPI. This level of detail, especially when paired with a thoughtful pricing strategy, is what transforms your startup financial projections template from a guess into an actual operational plan.
Projecting Expenses and Managing Your Burn Rate
A powerful revenue model is only half the battle. If expenses are out of control, it doesn't matter how much money is coming in. Smart expense management is what buys you time—the critical runway your startup needs to find its footing, achieve product-market fit, and begin scaling.
This is about more than just listing out your costs. It's about building a detailed, thoughtful expense forecast right inside your startup financial projections template.
Getting a Handle on Your Startup Costs
The first step is to organize your costs. This isn't just busywork for your accountant; it helps you see the fundamental cost structure of your business. Every single expense you have will fall into one of two buckets.
First, you have your one-time startup costs. Think of these as the initial investments you have to make just to open your doors. Things like:
- Business registration fees
- Initial legal consultations
- Purchasing essential equipment like laptops or desks
These are crucial to budget for upfront, but you won't see them on your monthly operating statements.
Then you have your recurring operating expenses (OpEx). These are the costs that keep the lights on and the business running day-to-day. We can break these down even further:
- Fixed Costs: These are the predictable bills that hit your bank account every month, no matter how many customers you have. Think office rent, employee salaries, and software subscriptions (like your CRM).
- Variable Costs: These costs move up or down depending on your business activity. For a SaaS startup, this might be your server hosting fees, which climb as more users sign on. For an e-commerce brand, marketing ad spend is a classic variable cost that scales with customer acquisition efforts.
Calculating and Making Sense of Your Burn Rate
Once you have a solid projection of your expenses, you can calculate one of the most important metrics for any early-stage company: your burn rate. This is simply the speed at which your company is spending its cash reserves.
There are two flavors of burn rate you need to track:
- Gross Burn: This is the total amount of cash your company spends each month. A simple, straightforward number.
- Net Burn: This is your gross burn minus any revenue you're bringing in. This number is the real gut check—it tells you exactly how much cash you're losing each month.
Your net burn is the true measure of your cash deficit and the figure investors will zero in on.
Case-Based Learning: A fintech startup extended its runway by three full months without raising a single extra dollar. How? They got smart about their variable costs. Instead of a fixed monthly marketing budget, they tied ad spend directly to customer acquisition milestones. Ad spend was only unlocked after hitting specific lead conversion targets, guaranteeing every dollar spent was pulling its weight. This is a prime example of financial management in action.
Knowing your net burn is everything. When you compare that number to your cash balance, you can calculate your financial runway—the number of months you have left before the bank account hits zero. You can find more strategies for managing your startup's financial runway on our blog.
Common Questions About Startup Financial Projections
Even after you've wrestled with your startup financial projections template, a few questions usually pop up. It happens to every founder.
Let's walk through some of the most common ones. Getting these right will give you confidence when it’s time to share your model with investors or use it for your own strategic planning.
How Far Out Should My Financial Projections Go?
This is a classic question. For most early-stage startups, a three-year forecast is the sweet spot. Some investors might ask for five, but three is the standard.
The real trick is in the level of detail you provide over time.
Your first 12 to 18 months need to be broken down monthly. This is your operational playbook, where you'll live and breathe your cash flow and hit those early milestones.
After that initial deep-dive, you can zoom out a bit. Shift to quarterly projections for years two and three. If you do go out to years four and five, annual figures are perfectly fine. Everyone knows the numbers get fuzzier the further out you go, but they still tell an important story about your long-term vision and the ultimate potential of the business.
What Are the Most Common Mistakes in Projections?
I've seen hundreds of pitch decks, and the same mistakes tend to surface again and again. Sidestepping these common pitfalls can make your projections instantly more credible.
Here are the big ones to watch out for:
- Wildly optimistic revenue forecasts that aren't grounded in a believable, bottom-up plan.
- Underestimating customer acquisition costs (CAC) and forgetting how long it actually takes to get a sales engine running.
- Ignoring the "hidden" costs like payroll taxes, business insurance, and legal or accounting fees. They add up fast.
- Confusing profit with cash flow. This is a deadly one. You can be "profitable" on paper and still run out of money.
One of the biggest mistakes I see is treating the financial model as a one-and-done document. It's not. Your projections should be a living tool that you update quarterly based on what's actually happening in your business and the market.
Should I Include Best-Case and Worst-Case Scenarios?
Yes, absolutely. Do not skip this. Building out best-case, worst-case, and base-case scenarios in your startup financial projections template shows you're a strategic thinker.
It proves to investors that you've thought through the risks and really understand what levers drive your business.
Your worst-case scenario is all about survival—it tells you the bare minimum cash you need to keep the lights on and defines your true runway. On the flip side, the best-case shows the explosive potential if things go even better than planned. This kind of sensitivity analysis adds a layer of professionalism and credibility that investors love to see.
Ready to build a financial forecast that wins over investors and guides your growth? The insights and frameworks at Spotlight on Startups are designed to give you the clarity and confidence you need. Explore our resources today!